The electrical activity of the human brain is an object of study since the beginning of the XX century, and since then a lot of techniques have been developed to obtain and interpret the electrical signals of the brain, with influence in a great sort of knowledge areas, from arts to medicine and engineering. The activities developed in this Project intend to develop a brain-computer interface, by an electronic circuit for pre-amplifying and filtering the influence of the electrical network and transfer the information to a data acquisition board in order to work with the data in the computer using LabView.
It’s widely known that the specter of the brain waves of the human brain follows a strict order observed in lots of experiments. The experiences also prove that each frequency of the cerebral specter means a different mental state. This project tries to isolate the frequencies of the cerebral specter in order to enable the interpretation of the cerebral waves and finally control something with it.
This project tries to emulate the Neurosky headset, a headset that uses as reference points in the scalp the frontal cortex (Fp1, using the 10-20 pattern) and the region of the ears, it’s also base it’s algorithms of interpretation of mental states in the relation between the different frequencies of the human brain.
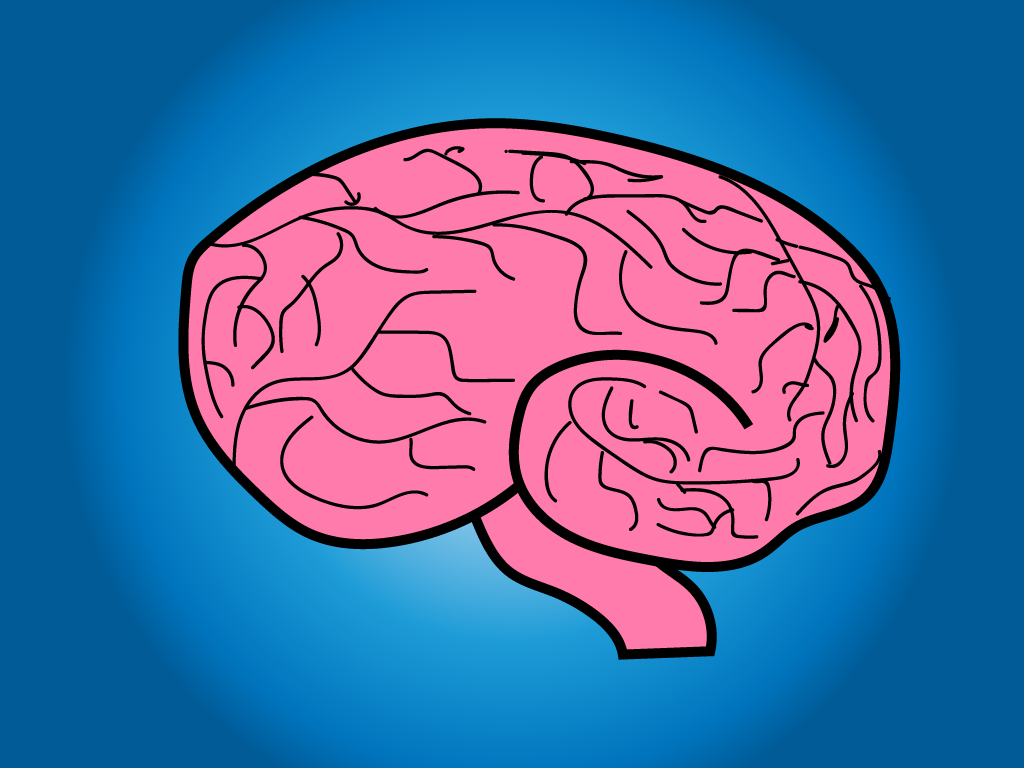
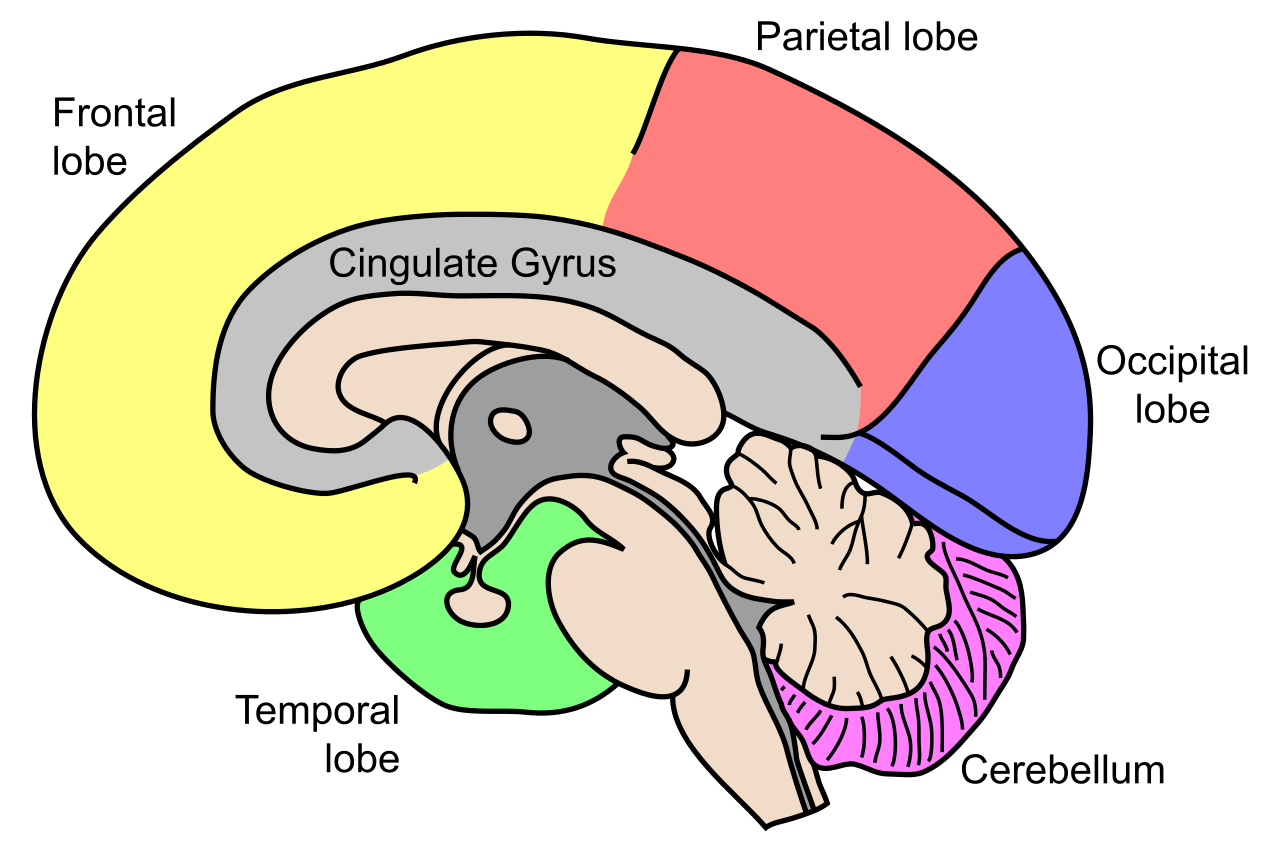
Physiology of the Human Brain
The human brain can be divided into four main regions, each region having a specific function. The four parts are the frontal lobe, the parietal lobe, the occipital lobe, and the temporal lobe. This project tried to obtain the brain waves from the frontal lobe, which is located in the frontal part of the head (brow). The Frontal lobe is responsible for logical thinking, the control of impulses, judgment, production of language, problem-solving and social behaving.
Each frequency of the brain waves specter indicates different mental states. Examples can be seen below:
- Delta waves can indicate a lesion in the frontal part of an adult brain or the posterior part of a child’s brain.
- Theta waves occur mainly under emotional stress, mainly in the parietal and occipital region.
- Alfa waves generally occur in a state of relaxation.
- Beta waves occur in an active state.
There are other brain waves, but they are less important or less useful to this project. The main characteristic in which the waves differ is the frequencies where we can find them. The waves and its frequencies are related in the table below.
| Wave | Frequencies (Hz) |
|---|---|
| Delta | 0,4 to 4 |
| Theta | 4 to 8 |
| Alfa | 8 to 13 |
| Beta | 13 to 30 |
Instrumentation
In order to achieve our goal in this project, we used the basic instrumentation for the acquisition of electrical signals from the brain (EEG). The final configuration is presented in the block diagram below.
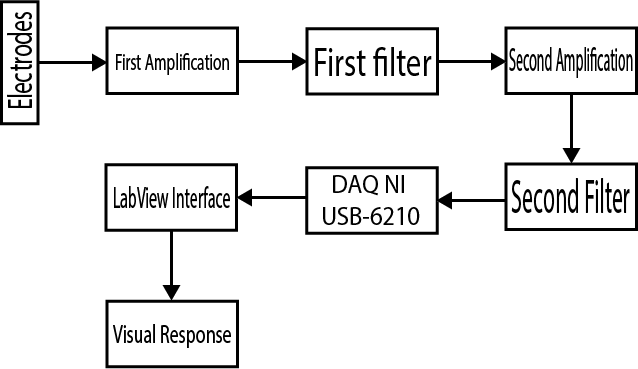
Project block diagram
Electrodes
The electrodes used were electrodes common used in electrocardiogram exams. They have soft cloth backing, solid gel, diaphoretic adhesive, and an AgCl pin.
Amplification and filtering circuit
In order to build an interface between the brain and the computer, we need to access the brain waves. To achieve that we used a circuit that provides us with one EEG channel. The circuit is presented below and was developed by Bernd Porr.
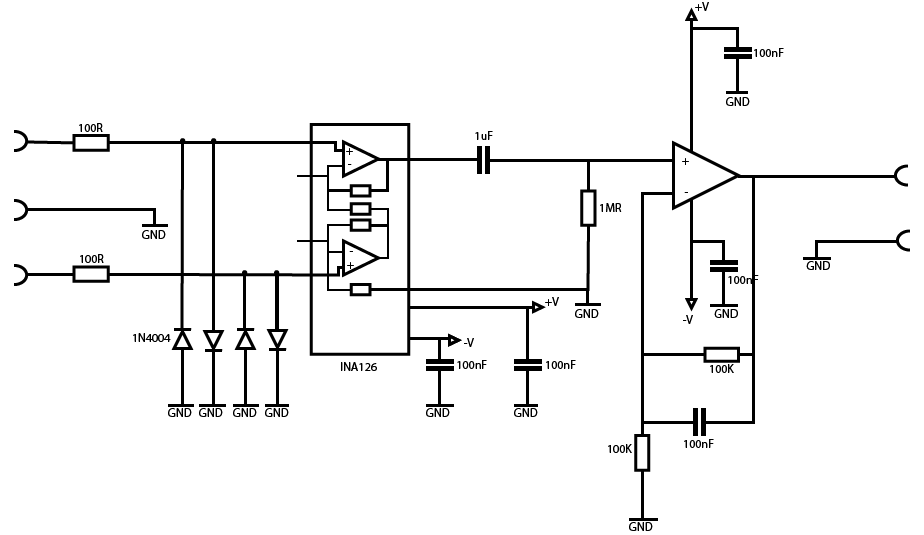
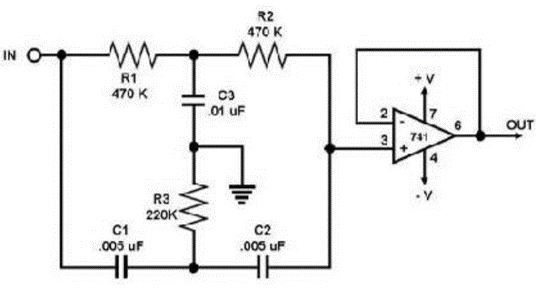
This circuit is a two-stage amplifier. The first stage is an instrumentation amplifier. The instrumentation amplifier is a special operational amplifier that is low noise and high impedance; it’s also more precise and accurate. The second stage is a simple operational amplifier in the non-inverter configuration. Between these two amplifiers, there is a high-pass filter, this filter possible interferences of the cc current. After the signal passes through the instrumentation amplifier, the high pass filter and the operational amplifier it goes through a 60 Hz Notch filter. This last filter is a simple passive filter and is presented down below.
Data Acquisition Board
The data acquisition board that we used was a National Instruments DAQ NI USB-6210. It acquires the differential voltage from the circuit output and sends this information to the computer.
LabView interface
LabView (Laboratory Virtual Instrument Engineering Workbench) is a famous development platform. It is programmed through a visual language based on the block with different functions that at first looks easy but soon we noticed that it follows the Bushnell’s law: “Easy to learn, hard to master”. With LabView, we were able to put the raw signal on the screen and also filter the bands of the brain waves specter. Then we developed an algorithm that, based on the specter of the brain waves and its interaction with the orbicular muscle, blinks an LED. The control of the LED can be interpreted as the control of one bit of information.
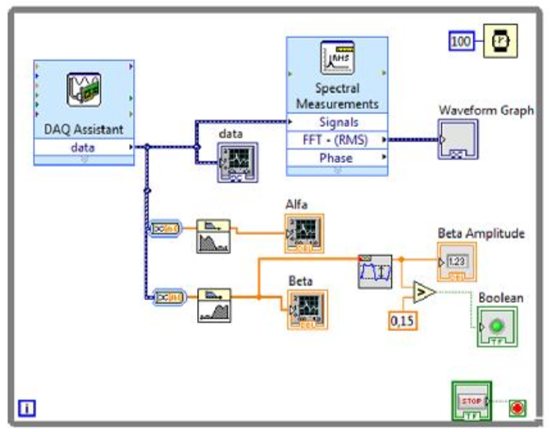
The algorithm filters the Alfa and Beta waves from the brain waves specter, measure its amplitudes and compares it to a pre-established value. We were not able to develop an algorithm equal to the one used by the NeuroSky Headset. Their algorithm is capable of measuring the mental state of the user just using the brain waves and then say if the user is in a state of concentration or relaxation. We were not able to interpret brain waves like that because of two reasons. Reason number one is that the LabView platform is not potent enough and the data acquisition board cannot acquire enough data with the necessary speed. Reason number two is that in order to achieve our goal we would need very advanced mathematics, as seen in“Analysis of EEG Signals For EEG-based Brain-Computer Interface” (2009), which we had no access. As we had access to the brain waves, but could not use it in a traditional way for developing a Brain-Computer Interface, we observed how the brainwaves behave in a range of different activities, and at the end of the experiments we noticed that the interference of the blinking of the eyes was very noticeable on the screen. As a result of our observations, we decided to use the influence of the blinking eyes (that increase the amplitude of the measured Beta and Alfa waves) to control a bit of information.
Results
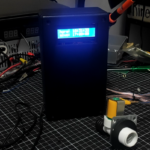
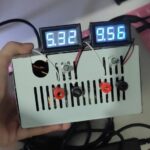
After the development of all the stages of the project and a lot of different tests, we developed the system described down below. For utilizing the developed system the user should be sitting in a comfortable chair and relaxing. Then, the electrodes must be placed in the mastoids (in order to work as reference points) and in the position Fp1 of the international 10-20 pattern for electrode placing. This pattern is presented down below.

After the correct placement of the electrodes, they are connected to the circuit with banana alligator clips. The circuit is then connected to the data acquisition board via wire up cables. Then the system is initiated and we can see that every time the user blinks, the LED on the screen blinks too. Down below we can see everything working in a video.
We can have as a conclusion that developing an interface between the brain and the computer is a very complicated thing, making necessary the use of a lot of different tools, from a lot of different knowledge areas, from medicine to engineering. We also could see the behaving of the brain waves and how they interact with the potentials generated by the muscles around it, also using it to control one bit of
References
Kasarwala J.N., Warrier J.S. and Sanghvi S.H. (2012). International Journal on Advanced Electrical and Electronics Engineering (IJAEEE). Volume-1, Issue-1.
Parokaran, J.V. July 2009. School of Innovation, Design
Bernard